Testing IVG
Table of Contents
I have recently installed IVG and used it in two different posts already. There were some problems and curiosities, though, so I decided to start a new post specifically about Sequence Tube Map and what I’m learning about this tool.
Starting and using IVG locally
I’ve installed IVG in the same directory I’m doing all my genome graph work in. To start the server, I use the following code:
cd /data3/genome_graphs/sequenceTubeMap
npm run serve
Then I use my local console to connect to localhost 3000 to be able to use IVG in my local browser:
ssh -f -N -L 3000:localhost:3000 spo12@127.0.0.1 -p 1234
Right now, the dataPath variable in the configuration points to “/data3/genome_graphs/CPANG/playground/day3/references/", but I think at some point we might have to create a specific directory to place graphs for visualisation in, or hopefully just put soft links so we don’t need copies.
Summary of work done in other posts
I’ve used IVG to help me analyse my five reference Pseudomonas aeruginosa genome graph already and want to briefly summarise my findings here.
Visualisation of selected genes/regions
Trying to find inversions in my five reference graph, I used IVG for visualisation. IVG doesn’t really visualise huge inversions like the one I was looking for, as it doesn’t show node orientation, but I did some general analysis with it there anyway.
First I learned that the graph with paths showing the complete annotation of all five reference strains is too much to handle even for the local IVG version on our server. That is a pity, but since IVG navigates based on a reference path you can simply select the right genomic position to look at your gene. Right?
Well, here things get a little tricky. I had a look at oprD, an important porin in P. aeruginosa, which I’ve analysed without genome graphs in detail before. The gene is on the plus strand in two of my five reference strains (PA14 and PA7), and (due to a huge genomic inversion) on the minus strand in the other two (PAO1 and LESB58, in PAK it is not annotated). Finding the start of oprD was easy in PA14 (PA14_51880, 4606220 - 4607551, + strand), for example, but more difficult in PAO1 (PA0958, 1043983 - 1045314, - strand). I don’t know the reason for this, but the ATG annotation in PAO1 is two nodes off.
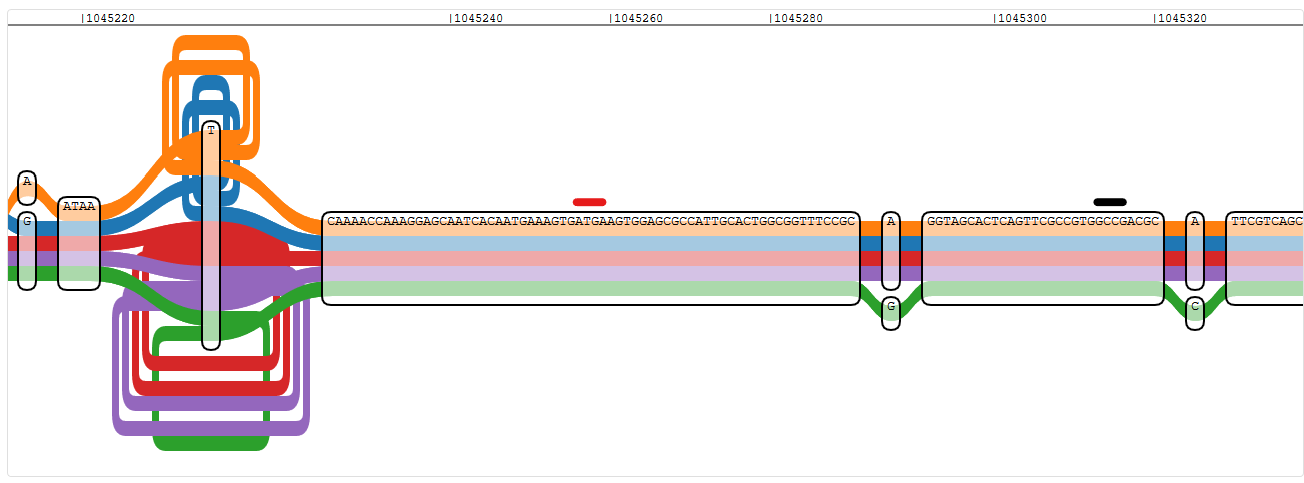
Pangenome graph region of the start of oprD, using PAO1 as reference - red is the true start of the gene, black is the one indicated by nucleotide position
This seems to be a problem with genes on the negative strand in general. I checked proS, which is just two genes upstream in PAO1 and also on the negative strand, and I found the ATG at around position 1,043,275 and not, as annotated, at 1,043,404.
This is not the only problem I have with IVG and genes on the negative strand, though. Once I’ve found the right start codon, I have to scroll to the right to follow oprD in PAO1. I wouldn’t mind that if the coordinate axis would still count down, but it does not. So while I’m scrolling through the graph from position 1,045,314 (start) towards position 1,043,983 (end), the coordinate axis says I’m scrolling towards 1,046,000 instead.
For comparison, I also looked at PA14_51890 (4607615 - 4608022), the gene downstream of oprD in PA14 which is on the negative strand, and I could not find the start codon in the region that IVG showed me around genomic position 4,608,022. What I found instead is the end of the gene, but in reverse complement. Apparently for PA14, if I want to look at a gene on the negative strand, I have to look for the reversed and complemented sequence, and I should find the start of the gene at the first genomic position given in the annotation and the end at the last, so the scrolling direction is correct.
I assume that this difference between PA14 and PAO1 is due to the order in which they were aligned or converted to a graph. The basis seems to have been one of the strains where oprD is on the plus strand, so PAO1 and LESB58 are more difficult to display than PA14 and PA7. On the other hand, for PA14 and PA7 I will most likely always have to have the reverse complement of genes on the negative strand handy to be able recognise them in the graph.
Side note: I joined the sequences together to create the graph with LESB58 first and PA14 last, and the same order seems to have been preserved for the graph creation, since LESB58 is path 0 according to odgi, and PA14 is path 4.
Visualisation of mapped reads
I also already used IVG to visualise mapped reads with my graph. Originally I was trying to figure out why some reads did not map to it as I would have expected that they do, here I just want to focus on the visualisation as such.
In order to be able to load the reads into IVG for visualisation, we need an indexed GAM file. I generated this with a script included in the IVG installation, but I could just as well have called vg gamsort myself:
cd /data3/genome_graphs/CPANG/playground/vg
/data3/genome_graphs/sequenceTubeMap/scripts/prepare_gam.sh CH3797_R1.vs.FivePsae.gam
cp CH3797_R1.vs.FivePsae.sorted.gam.gai CH3797_R1.vs.FivePsae.sorted.gam ../day3/references/
Then I used the xg index of the modified reference graph I mapped against and loaded the GAM index as well. This takes a little longer than just displaying the five references, but it works fine, as long as you don’t try loading more than 100 nucleotides (then it only works sometimes).
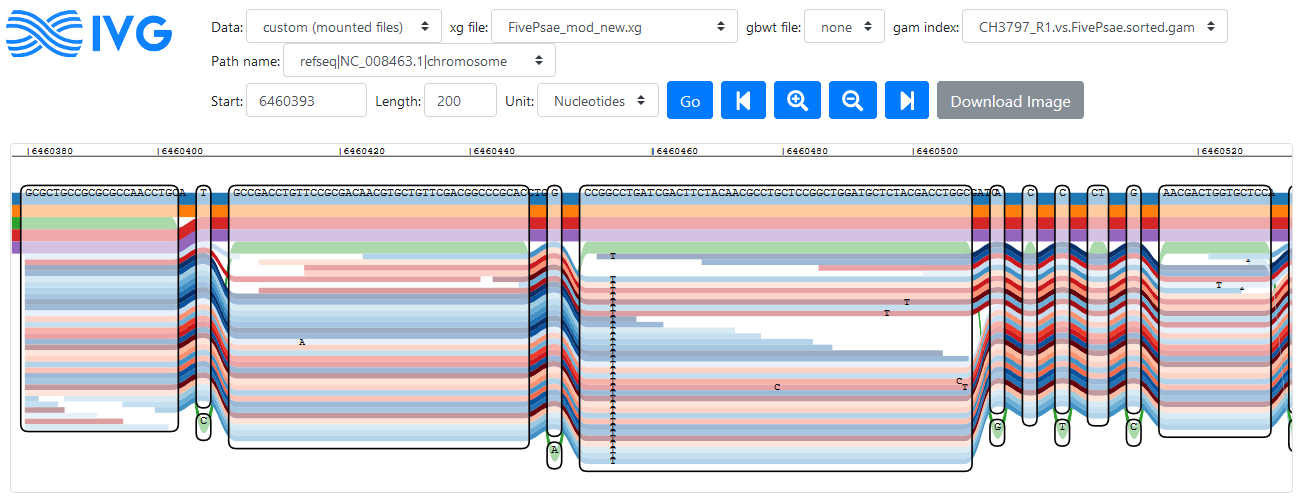 Reads mapping to a region in the PA14 reference genome (click to enlarge)
Forward reads are coloured in red here, reverse are in blue. Disregarding the problems with graph navigation, this looks like a nice tool to visualise read alignment to identify variants (like IGV for regular mapping). In the figure above a variant is visible that is not part of the five reference genomes, but supported by all reads that mapped to this region.
Looking through the oprD sequence (very slowly), I can see that the isolate which I mapped to the reference graph has at least one variant that the references don’t have. I can also see some really weird stuff like loopy reads, which turn into very loopy reads and with every move to the right, it gets worse - until it is gone (genomic position 4607220 looks normal again). The normal part has lots of variants towards the end of the gene, then.
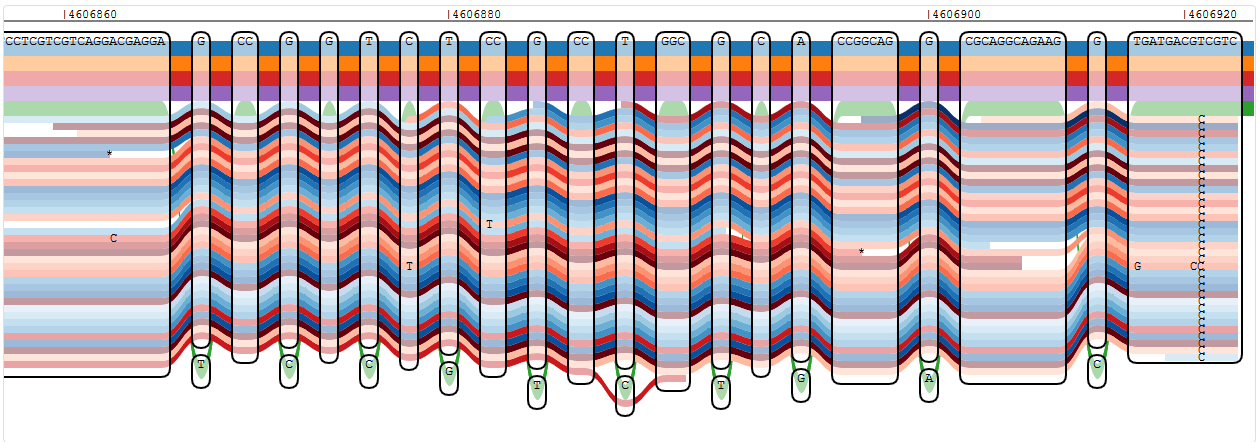 Reads showing a single variant in oprD that is not known from any of the reference strains
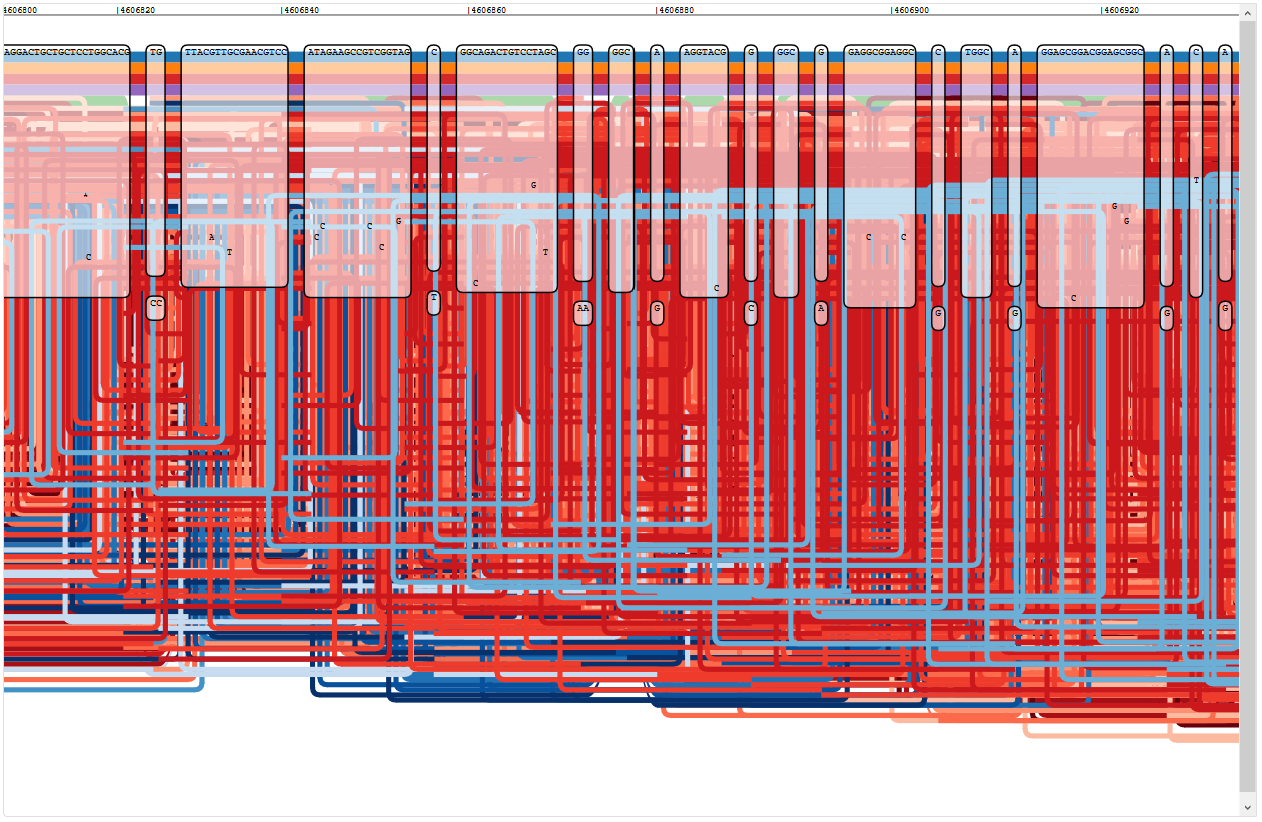 Loopy reads mapping to oprD (this got worse further into the gene)
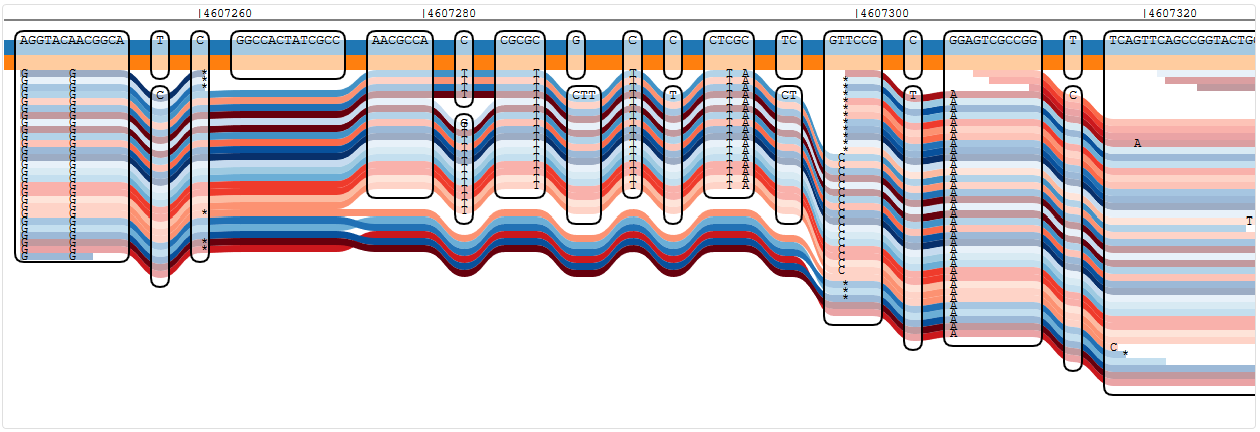 Reads showing a number of variants in oprD that are not known from any of the reference strains
All I actually wanted to see was if the isolate follows the PA14-version of oprD or the PAO1-version - they are very similar, but with some distinct single nucleotide variants. This was difficult to find by scrolling through the graph, so I selected a region with many differences between the strains manually - it appears that the isolate I chose for mapping carries the PA14 version of oprD, at least based on this part of the gene. This fits well with our phylogenetic tree, where the isolate is located in the PA14-like cluster.
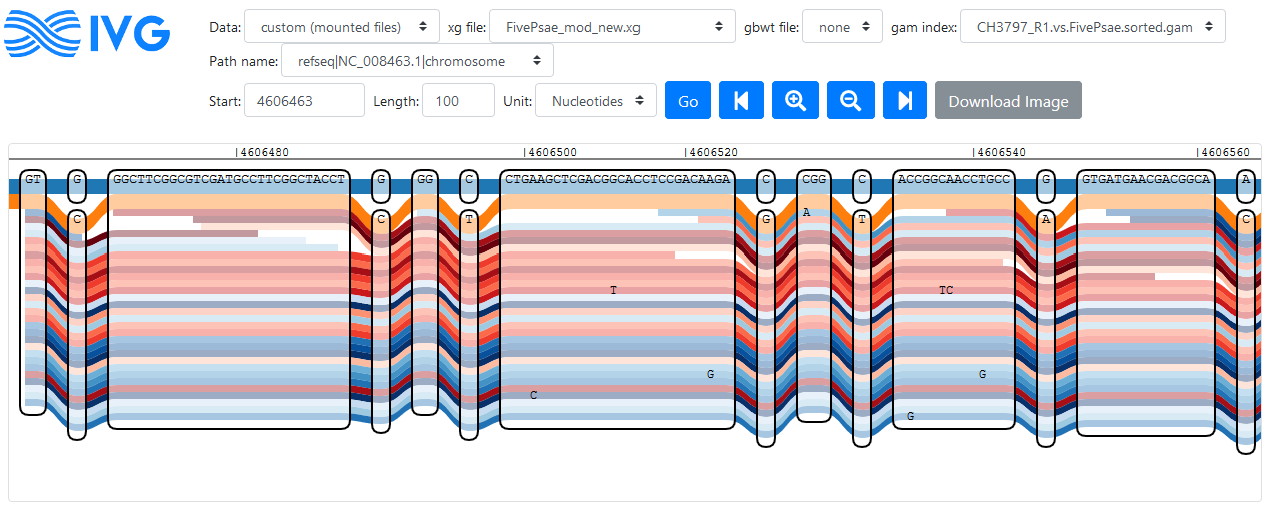 Reads following the PA14 path of oprD; PA14 is shown in orange, PAO1 is shown in blue, other references are not shown
Further testing of IVG
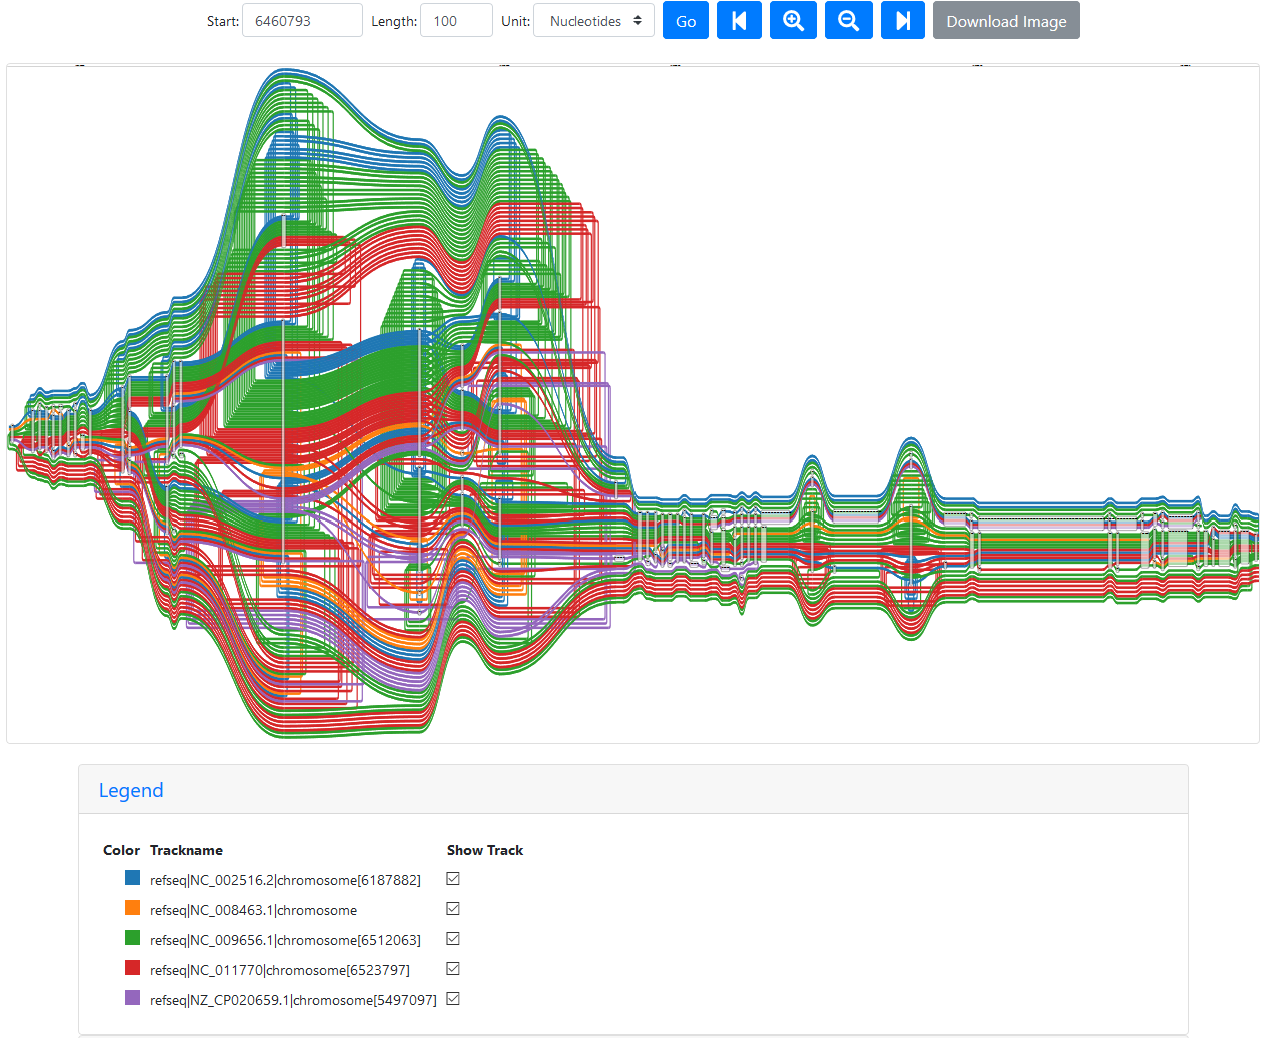
While looking through the graph, I discovered a region that looks very disconcerting, starting a little after position 6460700 in PA14:
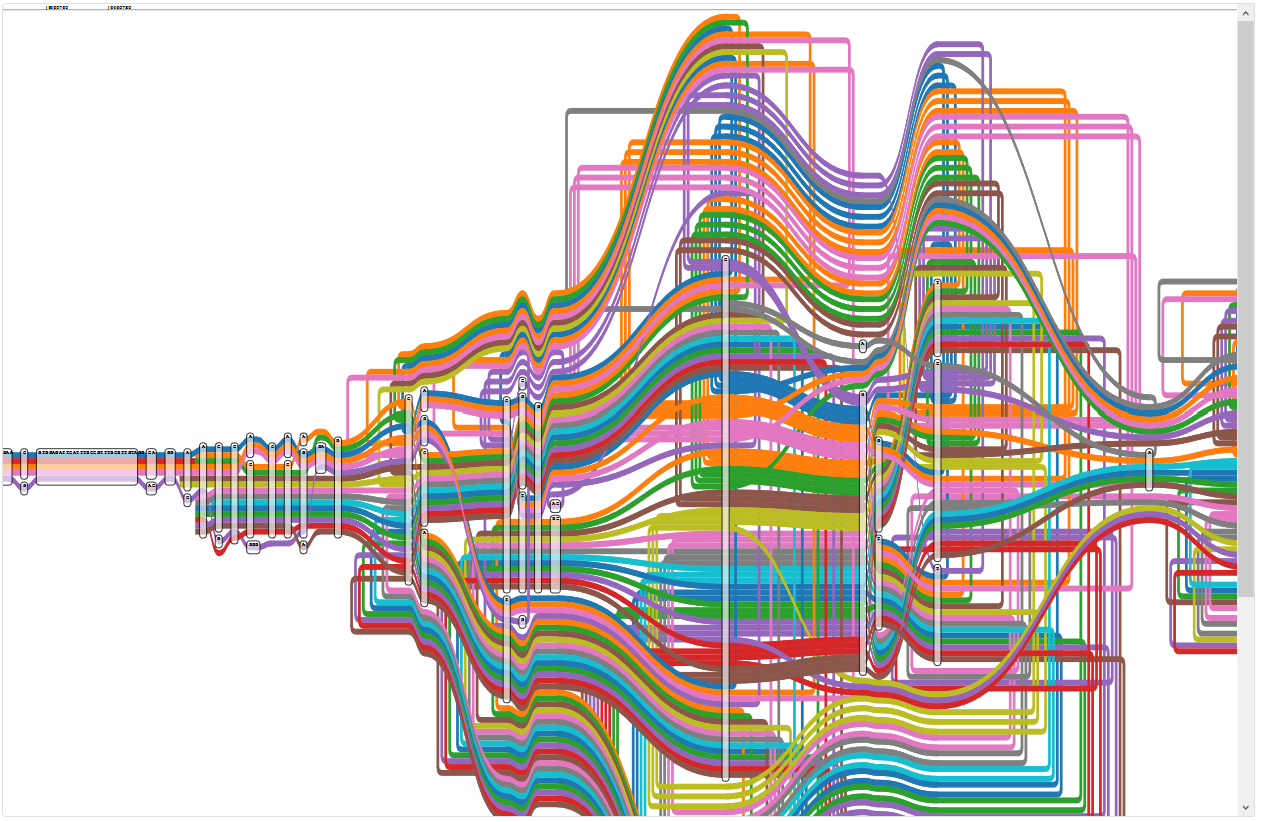 Region of the five reference graph with too many paths
The legend shows that the wealth of colour is due to some paths appearing multiple times:
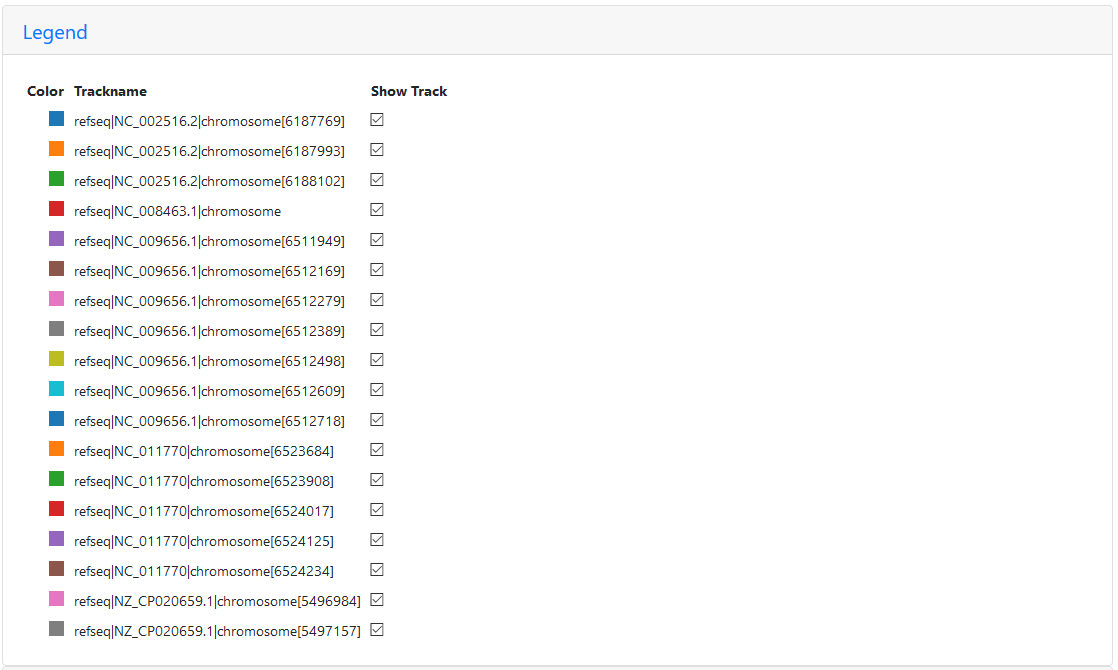 Legend for the region of the five reference graph with too many paths
Only PA14 (NC_008463.1) appears only once, since this strain doesn’t seem to have this region of the P. aeruginosa genome at all (the first red path ends where the chaos begins). PAO1 (NC_002516.2) appears three times, PA7 (NC_009656.1) appears seven times, LESB58 (NC_011770) five times, and PAK (NZ_CP020659.1) is included twice.
Interestingly, this pattern isn’t fixed (the number of times a path appears changes) and it can be “cleared” using a different starting position closer to the loopy region, like 6460780:
 Loopy region without duplicated paths
The paths are stil doubling back a lot, but at least they’re only annotated once.
Additionally, this seems to be specific to the nucleotide selection: Using node 695629 (equivalent to PA14 genomic position 6460700) with PA14 or PAO1 as reference returns only the expected five paths. It seems that this issue (or a similar one) appears in other people’s data as well, but there is no solution yet.